Are earthquakes increasing in strength or frequency?
I just found myself in a debate where the opposition claims that earthquakes are on the rise (judgement day, wrath of god, etc..), being slightly skeptical I of course needed evidence, and where better to get it than to analyse it for myself from the actual data?
How many earthquakes are there? I went to the United States Geological Survey for the raw data, they have a pretty big list named “selected earthquakes of general historic interest” (6.0+) earthquakes recorded (ordered by magnitude, strongest quake first) which seems to be used often to support the argument of increasing earthquakes.
http://earthquake.usgs.gov/earthquakes/world/historical_mag_big.php (Archived)
I then made a small computer program to parse the text and output it in csv format:
import java.io.BufferedReader;
import java.io.FileInputStream;
import java.io.IOException;
import java.io.InputStreamReader;
import java.io.Reader;
import java.util.ArrayList;

class Quake {
    public int year;
    public double strength;
}

public class Test {
    public static void main(String[] args) {
        ArrayList<Quake> quakes = new ArrayList<Quake>();
        try {
            loadQuakes(quakes);
        }
        catch(IOException ioe) {
            System.err.println(ioe);
        }

        generateStatistics(quakes);
    }

    private static void loadQuakes(ArrayList<Quake> quakes) throws IOException {
        Reader r = new InputStreamReader(new FileInputStream("quakes.txt"));
        BufferedReader br = new BufferedReader(r);

        String line = br.readLine();
        while(line != null && line.length() > 5) {
            String[] res = line.split(" ");

            Quake q = new Quake();
            q.year = Integer.parseInt(res[0]);
            q.strength = Double.parseDouble(res[res.length-1]);
            System.out.println(q.year + "," + q.strength);

            quakes.add(q);
            line = br.readLine();
        }

        System.out.println("Loaded " + quakes.size() + " quakes");
    }
}
data text file: quakes.txt (program input)
csv result file: quakes.csv (program output)
add this into open office and make a graph:
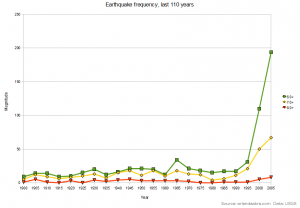
This graph makes it look like earthquakes are running rampant, and you might have seen a very similar graph on the Internet (YouTube and other places), used by conspiracy cranks as an argument that earthquakes are increasing. But fortunately this graph is very misleading.
this is because the data used to make it is complete rubbish, to quote the page the date is collected from: “selected earthquakes of general historic interest”.. These quakes have been hand picked as the most interesting ones, and the data has a HUGE bias towards newer earthquakes, so you can’t make any meaningful statistics out of it (except if you are making statistics of which earthquakes the guy who compiled this data finds “interesting”).
Update (Real data)
A scientist at the USGS was kind enough to send me a datafile with all the 7.0+ earthquakes from 1900 to 2010. Making some graphs from those data yields results consistent with what the experts on earthquakes are saying.. They are totally random and unpredictable, and there has been no increase of earthquakes since we started recording them:
NOTE: Unfortunately as this post is recovered from my old blog using the WayBackMachine only the smaller resized images have been saved
Frequency of earthquakes from 1900 to 2010:
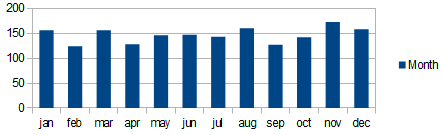
Earthquakes by month:
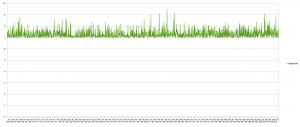
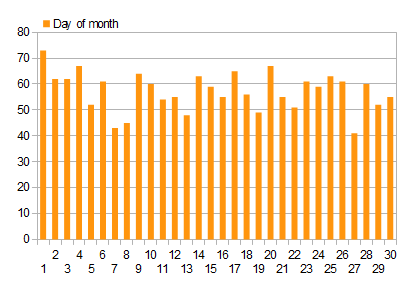
Earthquakes by day of month:
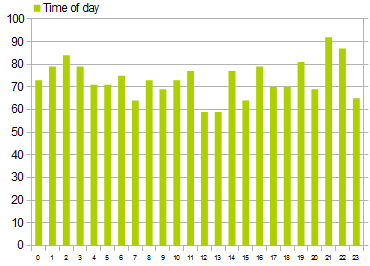
Earthquakes by time of day: